Back to all blogposts
Contents
SwiftUI is the future of iOS development, right? We are all excited about how it will influence our mobile development process. At the same time, we are wondering if SwiftUI is ready to shine right now. We are going to find out! In this blog post, we’ll try to build a completely custom line chart with extraordinary animations and Hollywood like effects ✨
How to build new chart with SwiftUI
But let’s start simple. You need to define some kind of data model for our new chart. Let’s start with a raw Point model, nothing too sophisticated just simple X/Y coordinates. You can extend its capabilities in the future if needed.
struct Point {
	let x: CGFloat
	let y: CGFloat
}
Use CGFloat instead of Double to get rid of conversion (the drawing system of SwiftUI is based on CGFloat).
You need some temporary mock data as well:
let data: [Point] = [

    .init(x: 1, y: 5),

    .init(x: 2, y: 4),

    .init(x: 3, y: 15),

    .init(x: 4, y: 6),

    .init(x: 5, y: 9),

    .init(x: 6, y: 12),

    .init(x: 7, y: 14),

    .init(x: 8, y: 11)

]
struct ChartView: View {
let xStepValue: CGFloat
let yStepValue: CGFloat
let data: [Point]
private var maxYValue: CGFloat {
data.max { $0.y < $1.y }?.y ?? 0
}
private var maxXValue: CGFloat {
data.max { $0.x < $1.x }?.x ?? 0
}
private var xStepsCount: Int {
Int(self.maxXValue / self.xStepValue)
}
private var yStepsCount: Int {
Int(self.maxYValue / self.yStepValue)
}
var body: some View {
}
}We initialize our ChartView with an array of Point models and values of the X/Y axis step. Add some computed properties which will be handy in the grid/chart calculations. Finally, let’s get our hands dirty in the actual drawing. You have to calculate line positions relative to view size. But how do you get the size of view in SwiftUI? Fortunately, here comes a GeometryReader to the rescue. It is a container view that gives you access to information about its size and coordinates. You are going to use it to calculate the position of the grid lines.
var body: some View {
    ZStack {
        gridBody
    }
}

private var gridBody: some View {
        GeometryReader { geometry in
            Path { path in
                let xStepWidth = geometry.size.width / CGFloat(self.xStepsCount)
                let yStepWidth = geometry.size.height / CGFloat(self.yStepsCount)

                // Y axis lines
                (1...self.yStepsCount).forEach { index in
                    let y = CGFloat(index) * yStepWidth
                    path.move(to: .init(x: 0, y: y))
                    path.addLine(to: .init(x: geometry.size.width, y: y))
                }

                // X axis lines
                (1...self.xStepsCount).forEach { index in
                    let x = CGFloat(index) * xStepWidth
                    path.move(to: .init(x: x, y: 0))
                    path.addLine(to: .init(x: x, y: geometry.size.height))
                }
          }
          .stroke(Color.gray)
      }
}
Pretty straightforward, calculate X/Y step width then iterate over steps count drawing vertical/horizontal lines. It’s a bit better but still, there is no chart at all Let’s add one more variable:
private var chartBody: some View {
        GeometryReader { geometry in
            Path { path in
                path.move(to: .init(x: 0, y: geometry.size.height))
                self.data.forEach { point in
                    let x = (point.x / self.maxXValue) * geometry.size.width
                    let y = geometry.size.height - (point.y / self.maxYValue) * geometry.size.height

                    path.addLine(to: .init(x: x, y: y))
                }
            }
            .stroke(
                Color.black,
                style: StrokeStyle(lineWidth: 3)
            )
      }
}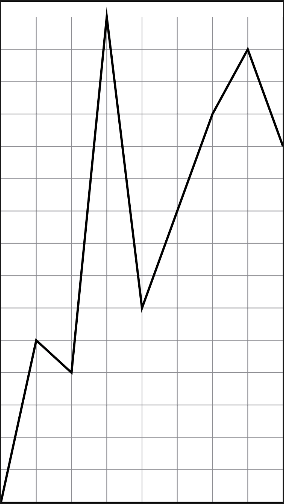
Here it is! Your first very own chart! Nothing too fancy, once more you have used GeometryReader to get the size of the view. With the size in the hand, you have to calculate coordinates of the next point. To do so you have to get a proportion of the x/y value of the point to the max values. The result is a part of the whole available width/height. Keep in mind that .zero point of view is in the top left corner while you are drawing from the bottom left corner. So to get the correct value of y you have to subtract the result from the view height. Then you simply draw a line to the calculated point.
How to modify your iOS app new chart
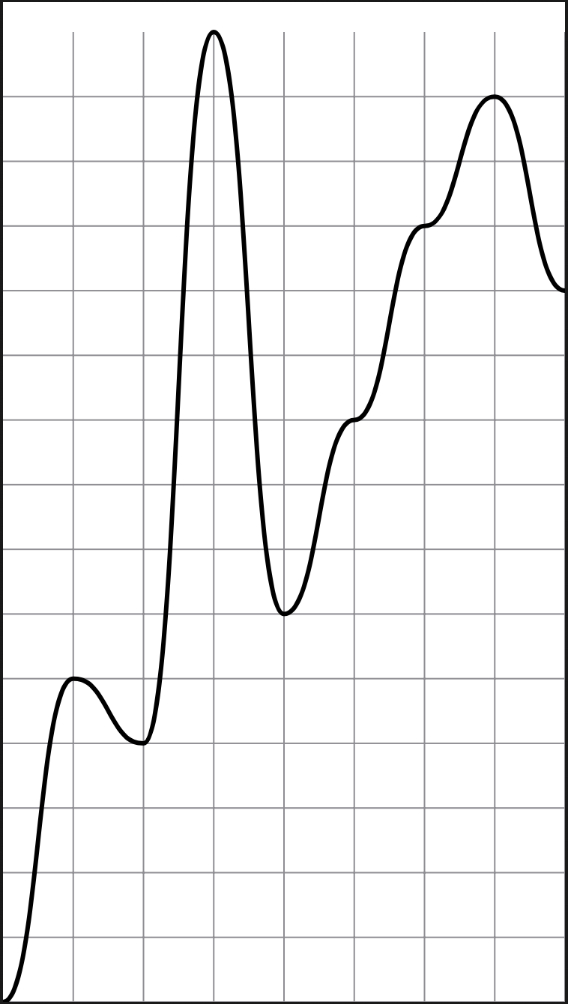
Your chart is almost ready but it looks a bit too… sharp.
What about making it a bit more curved? Let’s modify the chartBody like this:
private var chartBody: some View {
        GeometryReader { geometry in
            Path { path in
                path.move(to: .init(x: 0, y: geometry.size.height))
                // 1
                var previousPoint = Point(x: 0, y: geometry.size.height)

                self.data.forEach { point in
                    let x = (point.x / self.maxXValue) * geometry.size.width
                    let y = geometry.size.height - (point.y / self.maxYValue) * geometry.size.height

                    // 2
                    let deltaX = x - previousPoint.x
                    let curveXOffset = deltaX * self.lineRadius

                    // 3
                    path.addCurve(to: .init(x: x, y: y),
                                  control1: .init(x: previousPoint.x + curveXOffset, y: previousPoint.y),
                                  control2: .init(x: x - curveXOffset, y: y ))

                    previousPoint = .init(x: x, y: y)
                }
Here’s what is happening. First of all, you have to store the previous Point which will be used to calculate the position of curve points.
Now you can calculate X delta between current and previous Point. To get an offset value for curve points you have to multiply the delta with a new property lineRadius. It tells how curved the chart should be. The lineRadius has to be a value within 0…1 range (where 0 means no curve at all). Finally, instead of addLine use the addCurve function. This lets you add two curves on the line between two points. We can achieve that by specifying two control points. The first one is moved to the right side by the calculated offset and the second one to the left side. This gives us a nice effect of a curved line ⎰.
Now it’s way better! I can’t wait to build the rest of the functionalities on top of it. It’s a great start but there is a lot of work ahead of you. Now, you are going to spice your work up and make it pleasing to the eye. It’s ANIMATIONS & GRADIENTS’ time! 🚀
How to add animations & gradients for your iOS app
To kick-off building new functionalities, you have to do a small refactor to keep the project clean. SwiftUI is heavily forcing view structure to be composed of smaller pieces, so let’s follow this guideline and move your grid to a completely separate view.
struct GridView: View {
    let xStepsCount: Int
    let yStepsCount: Int

    var body: some View {
        GeometryReader { geometry in
            Path { path in
                let xStepWidth = geometry.size.width / CGFloat(self.xStepsCount)
                let yStepWidth = geometry.size.height / CGFloat(self.yStepsCount)

                // Y axis lines
                (1...self.yStepsCount).forEach { index in
                    let y = CGFloat(index) * yStepWidth
                    path.move(to: .init(x: 0, y: y))
                    path.addLine(to: .init(x: geometry.size.width, y: y))
                }

                // X axis lines
                (1...self.xStepsCount).forEach { index in
                    let x = CGFloat(index) * xStepWidth
                    path.move(to: .init(x: x, y: 0))
                    path.addLine(to: .init(x: x, y: geometry.size.height))
                }
            }
            .stroke(Color.gray)
        }
    }
}
OK, it’s time for real work. You would like to animate the drawing of the chart path. When the view appears it should nicely slide on the screen. You can use the trim(from: to:) method to achieve this. Let’s make some adjustments in the chartBody:
private var chartBody: some View {
        GeometryReader { geometry in
            Path { path in
                path.move(to: .init(x: 0, y: geometry.size.height))

                var previousPoint = Point(x: 0, y: geometry.size.height)

                self.data.forEach { point in
                    let x = (point.x / self.maxXValue) * geometry.size.width
                    let y = geometry.size.height - (point.y / self.maxYValue) * geometry.size.height

                    let deltaX = x - previousPoint.x
                    let curveXOffset = deltaX * self.lineRadius

                    path.addCurve(to: .init(x: x, y: y),
                                  control1: .init(x: previousPoint.x + curveXOffset,
                                                  y: previousPoint.y),
                                  control2: .init(x: x - curveXOffset,
                                                  y: y ))

                    previousPoint = .init(x: x, y: y)
                }
            }
            .trim(from: 0, to: self.isPresented ? 1 : 0)
            .stroke(
                Color.black,
                style: StrokeStyle(lineWidth: 3)
            )
            .animation(.easeInOut(duration: 0.8))
        }
        .onAppear {
            self.isPresented = true
        }
    }
There is not much to explain. Just trim a path from 0 to 1 in specified animation duration (in this case 0.8s).
To make it work you need @State property which will maintain the animation
@State private var isPresented: Bool = false

Wow! That was super easy and the outcome is awesome! ????
But you can’t leave the chart black&white, how about adding some gradients? Let’s start with the chart line. To fill it in with gradient just change stroke’s Color.black
.stroke(
  LinearGradient(gradient: Gradient(colors: [.primaryGradient, .secondaryGradient]),
                 startPoint: .leading,
                 endPoint: .trailing),
  style: StrokeStyle(lineWidth: 3)
)
.primaryGradient, .secondaryGradient are my custom colors added to the Color extension, they can be whatever you want, just use your imagination.
You can do even better by adding the background to the chart. To do so you can draw a closed path below the actual chart line and fill it with gradients. But first, you have to abstract away a path drawing.
struct LineChartProvider {
    let data: [Point]
    var lineRadius: CGFloat = 0.5

    private var maxYValue: CGFloat {
        data.max { $0.y < $1.y }?.y ?? 0
    }

    private var maxXValue: CGFloat {
        data.max { $0.x < $1.x }?.x ?? 0
    }

    func path(for geometry: GeometryProxy) -> Path {
        Path { path in
            path.move(to: .init(x: 0, y: geometry.size.height))

            drawData(data, path: &path, size: geometry.size)
        }
    }

    func closedPath(for geometry: GeometryProxy) -> Path {
        Path { path in
            path.move(to: .init(x: 0, y: geometry.size.height))
            drawData(data, path: &path, size: geometry.size)

            path.addLine(to: .init(x: geometry.size.width, y: geometry.size.height))
            path.closeSubpath()
        }
    }

    private func drawData(_ data: [Point], path: inout Path, size: CGSize) {
        var previousPoint = Point(x: 0, y: size.height)

        self.data.forEach { point in
            let x = (point.x / self.maxXValue) * size.width
            let y = size.height - (point.y / self.maxYValue) * size.height

            let deltaX = x - previousPoint.x
            let curveXOffset = deltaX * self.lineRadius

            path.addCurve(to: .init(x: x, y: y),
                          control1: .init(x: previousPoint.x + curveXOffset, y: previousPoint.y),
                          control2: .init(x: x - curveXOffset, y: y ))

            previousPoint = .init(x: x, y: y)
        }
    }
}
So, the drawing logic is now part of LineChartProvider. It has two accessible methods: pathand closedPath. The only difference between them is one additional step for closedPath which makes it a closed shape (this lets us fill it properly with gradient). The private drawData method is an actual drawing part of the provider, it’s abstracted away to easy reuse between the path and closedPath methods.
Also, you have moved some of the supporting computed properties from ChartView to LineChartProvider.
With those improvements ready, you can use it in the chart:
private var chartBody: some View {
        let pathProvider = LineChartProvider(data: data, lineRadius: lineRadius)
        return GeometryReader { geometry in
            ZStack {
                pathProvider.closedPath(for: geometry)
                    .fill(
                        LinearGradient(gradient: Gradient(colors: [.white, Color.primaryGradient.opacity(0.6)]),
                                       startPoint: .bottom,
                                       endPoint: .top)
                    )

                pathProvider.path(for: geometry)
                    .trim(from: 0, to: self.isPresented ? 1 : 0)
                    .stroke(
                        LinearGradient(gradient: Gradient(colors: [.primaryGradient, .secondaryGradient]),
                                       startPoint: .leading,
                                       endPoint: .trailing),
                        style: StrokeStyle(lineWidth: 3)
                    )
                    .animation(.easeInOut(duration: 0.8))
            }
            .onAppear {
                self.isPresented = true
            }
        }
}
Neat! But you can do even better. So far the animation doesn’t look natural. You have to add animation to the background as well!
ZStack {
    // Background
    pathProvider.closedPath(for: geometry)
      .fill(
        LinearGradient(gradient: Gradient(colors: [.white, Color.primaryGradient.opacity(0.6)]),
                       startPoint: .bottom,
                       endPoint: .top)
      )
      .opacity(self.isPresented ? 1 : 0)
      .animation(Animation.easeInOut(duration: 1).delay(0.6))

      // Chart
      pathProvider.path(for: geometry)
        .trim(from: 0, to: self.isPresented ? 1 : 0)
        .stroke(
          LinearGradient(gradient: Gradient(colors: [.primaryGradient, .secondaryGradient]),
                         startPoint: .leading,
                         endPoint: .trailing),
          style: StrokeStyle(lineWidth: 3)
        )
        .animation(Animation.easeInOut(duration: 0.8).delay(0.2))
}
This is way better! Manipulate the opacity of the background to fade it in nicely. Moreover, you are using the delay method to chain animations.
At the beginning, it seemed very complicated and complex but it quickly turned out to be easy peasy thanks to the SwiftUI magic. Although I am satisfied with the overall outcome, there are plenty of things that can be improved.It was just a test of SwiftUI’s capabilities, but you have tons of other possibilities to discover. Good luck.